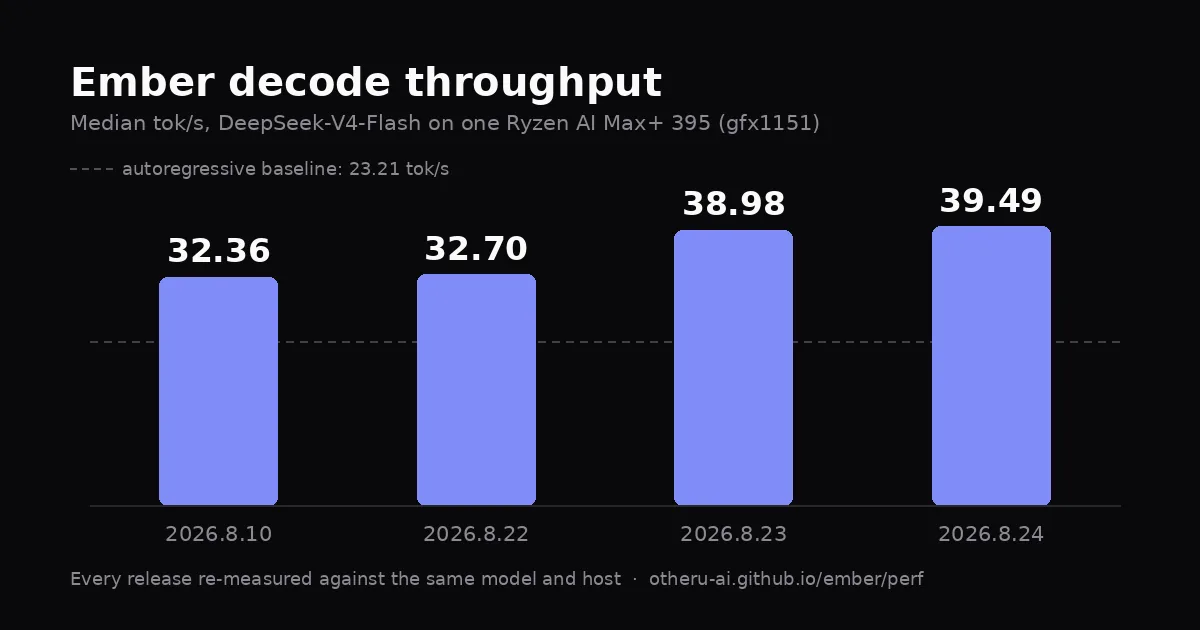
Ember 2026.8.24 is out, and it is already the image serving production here. Median decode on our Strix Halo box is 39.49 tok/s, up from 32.36 tok/s two weeks ago. The gain is worth having, but the more useful change is how it was established: every release in that window was re-run against the same model on the same machine, and the results are published on a page anyone can open.
What the numbers say
| Release | Median decode | Draft acceptance | Measured |
|---|---|---|---|
| 2026.8.10 | 32.36 tok/s | 1.000 | 2026-08-24 |
| 2026.8.22 | 32.70 tok/s | 0.989 | 2026-08-23 |
| 2026.8.23 | 38.98 tok/s | 0.981 | 2026-08-23 |
| 2026.8.24 | 39.49 tok/s | 0.981 | 2026-08-24 |
Every run used one Ryzen AI Max+ 395 with an integrated Radeon 8060S (gfx1151), 125 GiB of unified memory, and Fedora 44. Same target model and same drafter, both pinned by SHA-256. Three samples per release, 256 completion tokens, medians reported. With speculation off the same box decodes at 23.21 tok/s, so that is the floor these numbers sit above.
One wrinkle is worth stating plainly. The 2026.8.23 release notes record the width-6 verify change as 33.60 to 37.49 tok/s. Re-running those same images today puts the pair at 32.36 and 38.98. Absolute throughput shifts with the model file, the harness, and what else the machine was doing that afternoon. That drift is exactly why we re-measured every release instead of quoting each one's own note, and the table above is the version we will stand behind.
Where the speed came from
2026.8.23 did most of the work. The speculative path now verifies six tokens wide. Wave reductions were rewritten as hand-written assembly for gfx1151 and checked against the RDNA 3.5 ISA. The build selects WGP or CU mode per translation unit instead of once for everything, and UE4M3 scale decode lost its branches.
2026.8.24 adds kernel work further down in ggml. The rope block is now sized to the row rather than a fixed 256, the short-row reduction collapsed to its minimal form, and reduce_rows_f32 stopped launching one block per row.
Speculation that knows when to stop
The behavioral change is the one we care about most. Speculative decoding only pays when the drafter is right often enough to cover its own cost, and Ember used to be too optimistic on that point. It now abandons speculation after a single unqualified profitability pause, qualifies the wide verify path on a sustained rate rather than a lucky streak, and hands back to autoregressive decoding when batch-verify warmup cannot be reached. A bail-out that assumed throughput moves in one direction was simply wrong, and it is gone.
The context sweep shows what that buys:
| Context depth | Prompt tokens | Decode | Speedup | Time to first token |
|---|---|---|---|---|
| 0 | 43 | 39.19 tok/s | 1.68x | 0.6 s |
| 1,024 | 862 | 39.43 tok/s | 1.74x | 3.1 s |
| 4,096 | 3,925 | 38.00 tok/s | 1.67x | 11.5 s |
| 16,384 | 18,553 | 32.62 tok/s | 1.56x | 62.0 s |
| 32,768 | 38,059 | 24.79 tok/s | 1.30x | 140.4 s |
| 65,536 | 77,068 | 16.58 tok/s | 1.00x | 344.8 s |
| 98,304 | 116,077 | 14.86 tok/s | 1.00x | 630.5 s |
At 64K and beyond, draft acceptance falls to zero and the speedup settles at 0.998. Ember has stopped drafting and is running plain autoregressive decode. That is the right answer: speculation that cannot pay for itself now costs nothing instead of costing throughput.
The ceiling is honest in the other direction too. Decode at 96K is 14.86 tok/s and the first token takes over ten minutes. Prefill is what makes very long prompts expensive, not decode. Against 2026.8.10, time to first token on a short prompt dropped from 2.0 s to 0.6 s, and prefill at 4K context rose from 233 to 342 tok/s.
The release process is the feature
Most of this release is not engine code. It is the machinery that makes a performance claim mean something a month later.
Each release now produces a benchmark bundle automatically. Old releases are benchmarked as they shipped rather than rebuilt from current source, with failure reasons preserved instead of discarded. The released image is benchmarked in its own job after promotion, so the artifact that gets measured is the artifact people pull. Certification takes the documented GPU lock through a wrapper, waits for free memory before each model load, and fails loudly if production restarts underneath it. Pushes that only touch documentation no longer trigger a certification run at all.
The GPU lock deserves a note, because it explains the rest. Our benchmark box is our production box, with 125 GiB of unified memory shared between whatever is under test and whatever is serving traffic. Without a lock, a certification run and a live workload compete for that memory and both sets of numbers turn into fiction. Every measurement above depends on that lock holding.
For OtherU deployments
Production moved to ghcr.io/otheru-ai/ember:2026.8.24 today.
If you run Ember yourself, two earlier changes matter more than the speedup. 2026.8.22 added --host and EMBER_HOST for binding, plus EMBER_VERIFY_EXISTING_SHA256=0 to skip re-hashing a model you have already verified, which saves several minutes on every restart. 2026.8.23 made the compose file authoritative: the entrypoint no longer quietly overrides settings you put there, so what the file says is what the engine gets.
The performance dashboard carries the full bundle behind every number in this post, including the workload breakdown and the prefill curves that did not fit here.